- English
- 简体中文
- Esperanto
- Afrikaans
- Català
- שפה עברית
- Cymraeg
- Galego
- 繁体中文
- Latviešu
- icelandic
- ייִדיש
- беларускі
- Hrvatski
- Kreyòl ayisyen
- Shqiptar
- Malti
- lugha ya Kiswahili
- አማርኛ
- Bosanski
- Frysk
- ភាសាខ្មែរ
- ქართული
- ગુજરાતી
- Hausa
- Кыргыз тили
- ಕನ್ನಡ
- Corsa
- Kurdî
- മലയാളം
- Maori
- Монгол хэл
- Hmong
- IsiXhosa
- Zulu
- Punjabi
- پښتو
- Chichewa
- Samoa
- Sesotho
- සිංහල
- Gàidhlig
- Cebuano
- Somali
- Тоҷикӣ
- O'zbek
- Hawaiian
- سنڌي
- Shinra
- Հայերեն
- Igbo
- Sundanese
- Lëtzebuergesch
- Malagasy
- Yoruba
- Español
- Português
- русский
- Français
- 日本語
- Deutsch
- tiếng Việt
- Italiano
- Nederlands
- ภาษาไทย
- Polski
- 한국어
- Svenska
- magyar
- Malay
- বাংলা ভাষার
- Dansk
- Suomi
- हिन्दी
- Pilipino
- Türkçe
- Gaeilge
- العربية
- Indonesia
- Norsk
- تمل
- český
- ελληνικά
- український
- Javanese
- فارسی
- தமிழ்
- తెలుగు
- नेपाली
- Burmese
- български
- ລາວ
- Latine
- Қазақша
- Euskal
- Azərbaycan
- Slovenský jazyk
- Македонски
- Lietuvos
- Eesti Keel
- Română
- Slovenski
- मराठी
- Srpski језик

Tlhahlobo ea liteko tsa ts'ebetso ea Poneumatic ho hlahisa ts'ebetso tlasa bahahlauli ba fapaneng
In pneumatic conveying systems, the pressure gradient is a critical parameter that describes the flow state of gas and solid particles in pipelines. It directly reflects the energy consumption required to overcome resistance during conveying and significantly impacts efficiency, stability, and cost-effectiveness. Therefore, in-depth research on system performance under varying pressure gradients is essential for optimizing design, improving operational efficiency, reducing energy consumption, and minimizing material loss. This article presents an experimental analysis of how pressure gradient variations influence pneumatic conveying performance.
Fundamentals of Pneumatic Conveying & Pressure Gradient
How Pneumatic Conveying Works
Pneumatic conveying systems primarily use air source equipment (e.g., blowers, compressors) to generate high-speed airflow, propelling granular materials through enclosed pipelines. Based on solid-gas ratio and flow velocity, pneumatic conveying is categorized into two main types:
- Dilute-Phase Conveying: Low solid-gas ratio, high gas velocity, particles suspended in airflow. Ideal for short-distance, low-density material transfer.
- Dense-Phase Conveying: High solid-gas ratio, lower gas velocity, particles move in plugs or layers. Suitable for long-distance, high-capacity, or fragile/abrasive materials.
Pressure Gradient & Its Importance
The pressure gradient (measured in Pa/m or kPa/m) refers to the pressure change per unit pipeline length. In pneumatic conveying, it indicates the energy loss due to friction, gravity, and acceleration resistance.
Key impacts of pressure gradient:
- Energy Consumption: Higher gradients require more power from blowers/compressors.
- Flow Stability: Optimal gradients ensure stable flow (e.g., dense-phase plug flow). Too low → clogging; too high → excessive wear & energy waste.
- Conveying Capacity: Within a certain range, increasing the gradient enhances material throughput.
- Material & Pipeline Damage: Excessive gradients increase particle breakage and pipeline wear.
Experimental Methods & Performance Metrics
Experimental Setup
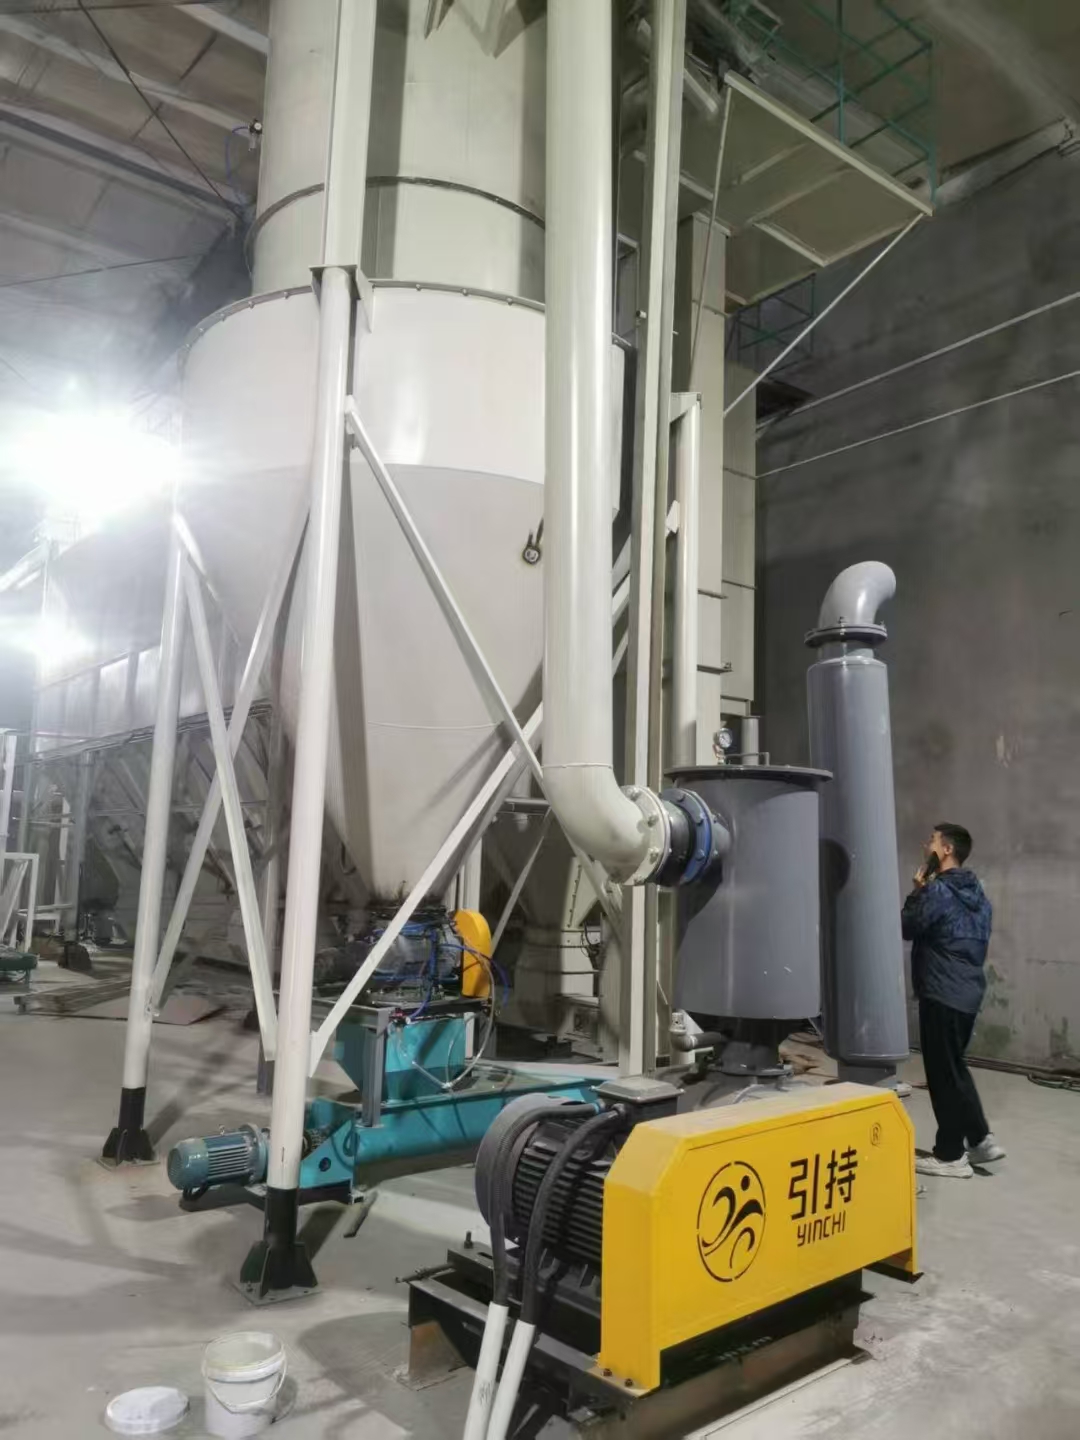
A typical pneumatic conveying test rig includes:
- Air supply (blowers, compressors)
- Feeding system (screw feeders, rotary valves)
- Conveying pipeline (transparent for flow observation)
- Gas-solid separator (cyclones, bag filters)
- Weighing & collection (measuring material throughput)
- Sensors & DAQ system:
- Pressure transducers (local/global gradients)
- Flow meters (gas volume)
- Velocity measurement (LDV, PIV)
- Temperature sensors
Key Performance Indicators
- Total pressure drop (ΔP<sub>total</sub>) = Gas-phase (ΔP<sub>g</sub>) + Solid-phase (ΔP<sub>s</sub>)
- Pressure gradient (ΔP/L) – Core parameter (Pa/m)
- Solid mass flow rate (m<sub>s</sub>) – kg/s or t/h
- Solid-gas ratio (μ) = m<sub>s</sub>/m<sub>g</sub>
- Energy consumption (E) = Power input / m<sub>s</sub>
- Particle breakage & pipeline wear rates
Key Experimental Findings
- Pressure Gradient vs. Conveying Capacity
- Increasing gradient (via higher gas velocity/solid loading) boosts material throughput, but non-linearly.
- Example: For 2mm plastic pellets in a 100mm pipe, raising ΔP/L from 100 to 300 Pa/m increased throughput from 0.5 to 2 t/h. Further increases yielded diminishing returns.
- Dilute-phase: Low gradients risk particle settling; optimal gradients ensure stable suspension.
- Dense-phase: Gradients below 150 Pa/m caused clogging; 250–350 Pa/m maintained stable plug flow; >450 Pa/m disrupted plugs into dilute flow.
- A U-shaped curve links gradient (ΔP/L) and energy consumption (E).
-
Example: A long-distance system achieved minimal energy use (5 kWh/t) at ΔP/L = 50 kPa.
- High gradients (e.g., 400 vs. 200 Pa/m) doubled glass bead breakage (0.5% → 2.5%) and pipe wear.
- Pressure fluctuations (FFT analysis) signal instability (e.g., clogging risk).
Engineering Optimization Insights
- Design & Selection: Match gradient ranges to material properties (density, abrasiveness) and distance/height requirements.
- Operational Tuning: Adjust air/feed rates to maintain ΔP/L in the "sweet spot" for efficiency.
- Smart Control: IoT sensors + AI-driven PID loops for real-time gradient optimization.
- Wear Mitigation: Use ceramic-lined pipes or reinforced bends for abrasive materials.
- Material-Specific Adjustments: Add flow aids or modify pipe roughness to alter gradient needs.
Conclusion & Future Outlook
This experimental analysis demonstrates how pressure gradients critically influence pneumatic conveying efficiency, stability, and cost. Future advancements in AI-powered predictive control and real-time adaptive systems promise further optimization, driving greener, smarter industrial conveying solutions.
About YINCHI
Shandong Yinchi Environmental Protection Equipment Co., Ltd. (YINCHI) specializes in advanced pneumatic conveying systems and bulk material handling solutions. Our R&D-driven designs ensure energy-efficient, low-wear performance across industries.
Contact Us:
📞 +86-18853147775 | ✉ sdycmachine@gmail.com